 The Right Stock At The Right Time®
 The Right Stock At The Right Time® The Right Stock At The Right Time® |
|
||
|
Follow The Market's Breadth To Spot Trend Reversals
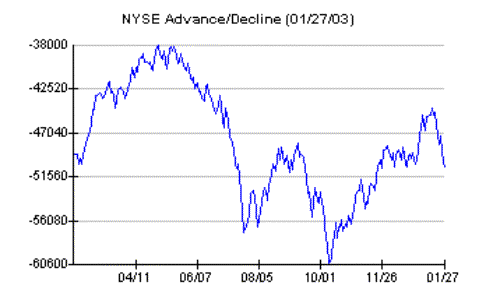
The NYSE Advance/Decline (A/D) Line is a daily running total of the number of NYSE stocks that advance minus those that decline. It is a good measurement of the markets breadth or strength and is an invaluable indicator when attempting to forecast the markets direction. Often, the end of a bull market can be predicted when the A/D Line begins to roll over while the DJIA is still making new highs. Conversely, at major bottoms, the A/D Line will bottom and start up several months before the DJIA puts in its final bottom. Market technicians refer to this phenomenon as bearish divergence at market tops and bullish divergence at bottoms.
Currently the NYSE A/D Line is in the -50000 area, up significantly from the 10/06/02 low (-60593) when the DJIA stood at 7286.27. Since that time, the DJIA rallied to 8931.68 on 11/27/02, sold off and then made a run at a new high on 01/14/03 when it closed at 8842.62. On 11/27/02, the NYSE A/D line was -48809. On 01/14/03 when the Dow closed 89 points lower that the previous high the A/D line totaled -44544, 4265 units higher than the previous peak. This is a classic case of bullish divergence and suggests that the broader market is in a lot better shape than the decline in the Dow below 8000 would have you believe.
 The daily and weekly number of new 52-week highs and lows is also a good indication of the markets strength. It isn't necessarily the number that is important but whether the numbers are expanding or contracting. When the market is in a long-term down trend, the number of new highs will be diminishing while the new lows will be expanding. As the market tries to find a bottom, a shift will begin to occur as the number of new lows begins to contract. Conversely, at significant tops the number of new highs will begin to contract. If the DJIA makes a new high or new low and the move is not confirmed by an expansion of the number of highs at market tops or lows at a bottom, a trend reversal is usually at hand. The number of new highs peaked on 01/06/03 at 125 when the DJIA closed at 8773.57 and has been contracting ever since suggesting that the recent decline has a way to go.
|