 The Right Stock At The Right Time®
 The Right Stock At The Right Time® The Right Stock At The Right Time® |
|
||
|
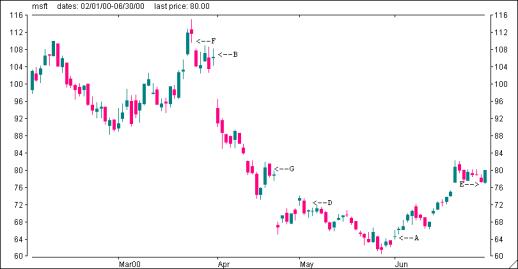
Candlestick Charts  Minor Chart Formations: A) Star: Stars indicate reversals. A star is a small body candlestick that occurs after a candlestick with a large body and the bodies don't overlap. B) Hammer: A small body and a long lower shadow. The body can either be red or green. This is a bullish candle if followed by a significant up-trend. C) Hanging Man: The opposite of a hammer, small body and a long upper shadow. This is a bearish candle if followed by a significant down-trend. D) Harami: A formation which denotes a decrease in momentum. It occurs when a candle with a small body follows a candle with a large body. A red candle followed by a green candle would suggest a decrease in downward momentum. The opposite scenario, a green candle followed by a red one, would indicate a decrease in upward momentum. E) Doji: Open and close are the same price. Dojis reflect indecision. F) Piercing Line: A two-candle formation when the first candle is a long red line followed by a long green line candle. The second candle opens lower than the first candles close and closes above the first candles mid-point. This is a bullish pattern. G) Shooting Star: A two-candle configuration that signals a minor bearish reversal if it occurs after a rally. The first candle is a long green line followed by a star candle with a long upper shadow. H) Morning Star: A bullish configuration consisting of three candles. The first candle is a long red line followed by a red or green star. The third candle is a long green line.  Major Chart Formations: The following are the most significant major bullish/bearish chart formations. An example of each is located on the above chart of MSFT with the exception of C (Abandoned Baby Doji). A) Gravestone Doji: A doji (open and close are the same) and the high is significantly higher than the open, high and closing prices. This formation typically occurs at the bottom of a trend and signals a bullish reversal. B) Dragonfly Doji: A doji (open and close are the same) and the low is significantly lower than the open, high and closing prices. This formation typically occurs at the top of a trend and signals a bearish reversal. C) Abandoned Baby Doji: A doji, which occurs at the bottom of a chart formation with gaps on both sides of the doji. D) Harami Cross: This formation signals a market top. It consists of a harami, which is a long black line candlestick which precedes and engulfs a doji with no body. E) Engulfing Pattern: A two-candle bullish formation consisting of a small long red line engulfed by the second candle, a long green line. F) Evening Star: A bearish pattern usually occurring at a top. The formation consists of three candles. The first is a long green line followed by a star and then a long red line. The star can be either red or green. G) Dark Cloud Cover: A two candle formation whereby the first candle is a long green line and the second candle is a long red line whose body is below the center of the first candle. This is a bearish formation. The Market Edge 'Smart Chart ' component provides candlestick charting along with bar, line and Point & Figure charting capabilities. To activate Smart Chart, click on 'Launch Smart Chart' located in the upper right hand corner of any page. Click on 'Chart Type' and then on 'Candle".
|